The Multi-Step Qustion Type
Use this question type for multi-step problems with mathematical expressions, such as solving equations, factoring or expanding expressions, differentiating, integrating, rewriting expressions, arithmetic, and more.
Multistep is unique in its capability to support students while they work on problems. This allows students to show their work, learn from their mistakes, and experience success when they ultimately solve the problem.
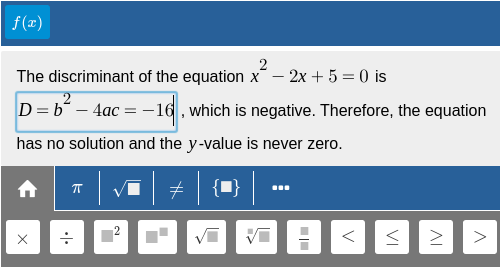
Example: Solve an Equation
Type an intermediate step and press enter. See how Algebrakit checks your work and gives feedback if the input is incorrect.
Our custom Didactical Math Engine automatically handles the substep evaluations, hints and error feedback, which greatly reduces the authoring effort.
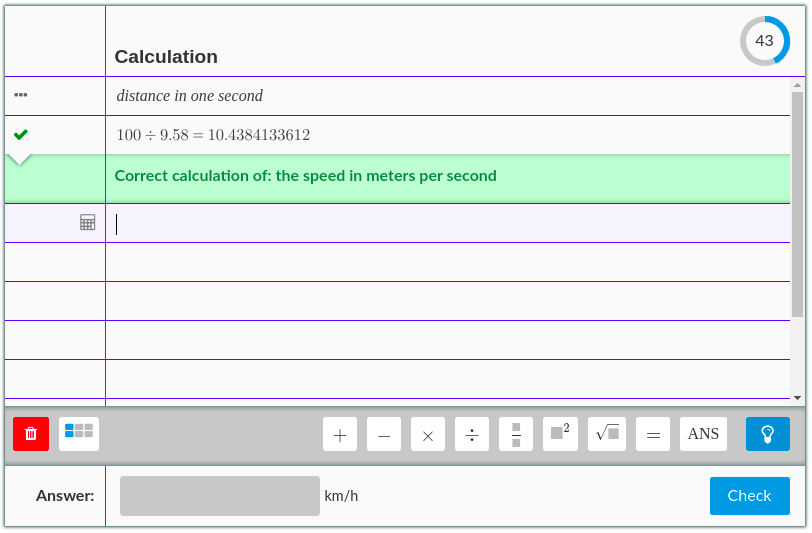
Example: Word Problems
The Multistep question type not only supports algebraic manipulation. You can also use it for word problems to develop modelling skills and conceptual understanding.
The Geometry & Graphs Question type
This question type is for two-dimensional concepts, such as geometry, coordinates, function graphs, and graphs of vertices and edges. The diagrams are dynamic, allowing students to drag points to discover mathematical properties.
The Geometry & Graphs question type supports automatic evaluation based on author-defined criteria. It also allows you to create randomized questions.
Example: Geometry & Graphs as an interactive resource
You can use Geometry and Graphs as an interactive resource to allow students to experiment and get a feel for mathematical properties.
This example shows Aubel’s Theorem. Drag the blue points and see how the dashed lines always remain perpendicular!
See the documentation for an overview of the many tools you can use to create custom constructions.
Check out also these examples:
Example: Geometry & Graphs as a question type
You can also use Geometry and Graphs as an independent question type with automatic evaluation.
Check out also these examples:
Example: Combine with other question types
Geometry and Graphs can easily be combined with one of the other question types, like in this calculus exercise.
Math Table
Tables occur almost everywhere in math education. Function tables, series, and ratio tables are just a few examples.
Tables are not just collections of values but often represent an underlying relation. Algebrakit can automatically evaluate student input against these relations and provide personalized hints and error feedback.
You can use Math Table to create many types of tables. Add rows, columns, and headers as needed, and add mathematical expressions, text, or input to cells. Optionally, add arrows above or below the table. These arrows can have input fields as well.
Example: Function Table
A basic application of a table. Calculate the value in each cell.
Example: Ratio Table
An important tool for fractions and percentages is the ratio table. This tool is available as a specialization of the Math Table question type. Algebrakit will automatically validate if the ratio table is valid and if the operations on the arrows are correct.
The arrows can also be used on regular (non-ratio) tables. Relevant for investigating linear, exponential and quadratic relations.
Example: Product Sum Method
An example of an open question. Students must find two divisors of -30 with -13 as their sum. They are free to try any set of values, while Algebrakit validates if the numbers are valid divisors and if they are summed correctly.
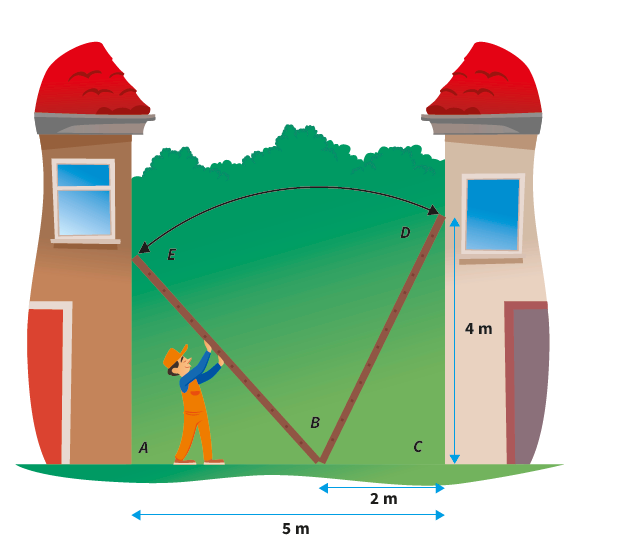
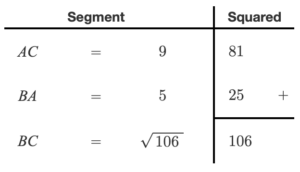
Example: Pythagoras Theorem
This is a nice example of a non-standard application demonstrating Math Table’s flexibility.
Segment BC must be in the bottom row, while the order of the two top rows is free.
Fill in the Blanks
This is a compact question type for single-step questions. Algebrakit’s Didactical Math Engine automatically evaluates math expressions input by students.
Example: Intervals
A simple question involving three input elements.
Example: Input inside formulas
Fill in the Blanks also supports editing within mathematical formulas, like the input field under the square root.
Example: Flexible order of answers
Sometimes, you can write answers in different input fields. In this example, you can swap answers 2 and 3, and the answer will still be correct. This situation often happens in mathematics and is correctly handled by Algebrakit’s Fill in the Blanks question type.
Written Arithmetic
This is a question type for multi-digit addition, subtraction, multiplication, and division. Algebrakit evaluates every digit immediately when entered and offers support through the progress indicator and through error feedback.
Written Arithmetic can be configured to follow the exact requirements of notation and solution strategy in your region or country.
Example: Subtraction
A subtraction problem where students can choose their approach: an extended form or a short form with regrouping (“borrowing”).
See other problems in the Algebrakit Documentation.
Example: Long and short forms
Written Arithmetic supports multiple strategies to solving a problem. The “Long form” is a more extended but intuïtive approach to solving multi-digit problems.
Solve this problem yourself in the Algebrakit Testbench.
Arithmetic Notebook
A smart notebook designed for story problems. Students can choose a custom solution strategy while Algebrakit offers support with automatic evaluation, formative feedback and progress indication.
Example: Discount stickers
This example shows how solving story problems requires many thinking steps
- Deciding how to apply the stickers effectively
- Choosing a strategy: find the total discount first or calculate the discounted price for each product separately. Both approaches are correct.
- Calculating the discounts using percentages.
You don’t want to split the story problem into these smaller problems, as it would eliminate the essence of story problems. Instead, Arithmetic Notebook presents one input area. Support is offered when asked by clicking the Hint or Check button.
Read more about Arithmetic Notebook in the Algebrakit documentation.
Open Math Answer
While all learning environments offer an open question type, most lack a formula editor that lets students conveniently enter mathematical expressions. That’s why we created the Open Math Answer question type.
Example: freeform input
See how students can conveniently input natural language and mathematical expressions. When self-assessment is enabled, the student is shown the solution after submitting.


